

Coaching analytics links what a coach actually does in a session to the behavior change and business outcomes that follow, so you can see which coaching moves work and which ones just feel productive. The value shows up fast: instead of guessing whether coaching “helped,” you get signals across three tiers, how often coaching happens, whether behaviors shift afterward, and whether outcomes like retention or win rate move. That’s the whole point of measuring coaching effectiveness with data instead of instinct.
TL;DR:
- Focusing on standardizing data capturing through unique session IDs and consistent field names is essential for accurate coaching impact analysis.
- Early measurement should prioritize utilization and behavioral KPIs over predictive or prescriptive models, which require more mature data and governance.
- Connecting coaching sessions to outcome data depends on integrating session notes, recordings, assessments, and performance records with reliable ID links and cohort tagging.
- Implementing a routine, with clear roles and templates, helps maintain data quality and ensures ongoing tracking of coaching effectiveness.
- Using a dedicated practice-management platform can streamline data collection and reduce administrative friction, but defining and tracking meaningful KPIs remains crucial for impact measurement.
Table of Contents
- What Coaching Analytics Systems Actually Do
- Why Analytics Maturity Matters More Than Fancy Dashboards
- Which Coaching Metrics and KPIs Actually Matter?
- What Data Sources Feed a Coaching Analytics Program?
- How Do You Measure Coaching’s Actual Impact?
- How Do You Put This Into Daily Operations?
- How ClickCoach Reduces Coaching Data Friction
- Where Coaching Analytics Delivers the Most Value Next
- Bringing the Playbook Into Your Coaching Practice
- Sources
- FAQ
What Coaching Analytics Systems Actually Do
Most coaching analytics tools do three jobs: capture, connect, and surface. Get these right and everything else—dashboards, predictions, reports—follows naturally.
Capture means pulling raw material into one place: session notes, call recordings, scorecards, and practice or homework completion data. If this step is inconsistent, nothing downstream can be trusted.
Connect is the harder problem. It means tying a specific coaching session to a specific coachee’s later performance, whether that’s a sales rep’s close rate or a client’s assessment score. Coaching analytics platforms connect coaching interactions to outcome data precisely so teams can see which interventions move the needle, rather than just archiving conversations.

Surface is what the coach or manager actually sees: dashboards, trend alerts, and outlier flags.
Before choosing or building a system, weigh these deployment factors:
- Does it integrate with your existing CRM, LMS, or performance system, or will you be exporting spreadsheets by hand?
- Can non-technical coaches read the output without a data analyst translating it?
- Does it store session-level detail long enough to run cohort comparisons later?
Why Analytics Maturity Matters More Than Fancy Dashboards
Not every coaching program needs predictive models. Most need to walk before they run, and a staged framework helps set realistic milestones. Sports science researchers describe a four-stage progression from descriptive to prescriptive data analytics that applies just as well to coaching effectiveness.
- Descriptive — what happened. Session counts, attendance, scorecard averages. Every program should have this within weeks.
- Diagnostic — why it happened. Comparing high-performing cohorts against low-performing ones to isolate which coaching behaviors correlate with better results.
- Predictive — what’s likely to happen. Using historical patterns to flag which clients or reps are at risk of stalling.
- Prescriptive — what to do about it. Recommending a specific coaching intervention based on predicted risk.
The same research warns that prescriptive analytics is genuinely hard to implement well and depends on governance most coaching programs haven’t built yet. Skipping straight to predictions without solid diagnostic groundwork produces confident-sounding numbers nobody should trust.
Pro Tip: Don’t chase a predictive model in year one. Spend that time getting descriptive numbers clean and diagnostic comparisons repeatable. The maturity ladder rewards patience more than ambition.
Which Coaching Metrics and KPIs Actually Matter?
Coaching metrics fall into three tiers, and mixing them up is the fastest way to produce a dashboard nobody trusts. Utilization tells you coaching is happening. Behavioral metrics tell you it’s changing something. Outcome metrics tell you it mattered.
- Tier 1, utilization: coaching session frequency, adherence to the coaching cadence, no-show and reschedule rates.
- Tier 2, behavioral: scorecard field completion, homework or practice-task completion, talk ratio (how much the coach talks versus the client or rep), specific skill markers noted in session.
- Tier 3, outcome: ramp time to competency, win rate or goal-attainment rate, client or employee retention, movement on standardized assessment scores.
Define each KPI operationally before you track it. “Coaching frequency” should mean a specific number, sessions per client per month, not a vague sense of “regular check-ins.” Review utilization weekly, behavioral metrics monthly, and outcome metrics quarterly, since outcomes take longer to move.
How fast should you expect outcomes to shift? Systematic reviews of coaching in health and wellness contexts found measurable improvements in quality of life and self-efficacy typically emerge over months, not days. Build that lag into your reporting cadence or you’ll declare failure prematurely.
What Data Sources Feed a Coaching Analytics Program?
A coaching analytics program is only as good as what feeds it, and most programs fail here before they ever reach a dashboard.
The common inputs are session notes, transcribed call or video recordings, LMS and assessment scores, CRM or performance-system records, and periodic client or employee surveys. The integration pattern matters as much as the source itself: you need event-level joins that link a specific session to a specific outcome record, consistent session-to-user linking (using the same coach ID and client ID every time), and cohort tagging so you can group clients by coach, program, or start date.
Run through this readiness checklist before you build anything on top of your data:
- Every session has a unique ID linked to a coach and a client.
- Notes and scorecards use the same field names across every coach on the team.
- Consent for recording and data use is documented, not assumed.
- Storage retention periods are defined and match your privacy obligations.
- A test query can actually join session data to outcome data without manual cleanup.
That last item is where most programs stall. The mapping between session, coach, and client IDs has to be enforced from day one, or you’ll spend months reconciling spreadsheets instead of analyzing results.
How Do You Measure Coaching’s Actual Impact?
Measuring impact means connecting coaching to results without overselling what the data can prove. A handful of designs handle this responsibly.
- Cohort comparison — compare a coached group against a similar uncoached group over the same period. This is the simplest defensible design.
- Matched-cohort comparison — pair coached individuals with similar uncoached peers (same tenure, role, or starting skill level) to control for obvious confounders.
- Pre/post analysis — track the same individuals before and after coaching begins, watching for the lag windows health coaching research documented.
- Simple A/B testing — where feasible, randomly assign coaching intensity across two groups and compare outcomes directly.
Behavioral metrics serve as mediators here. If ramp time drops but talk ratio never shifted, the coaching probably isn’t the cause. Report outputs like “a measurable increase in yards-per-carry reduction in ramp time for the coached cohort” or “improvement in assessment scores across three quarters,” and always attach the comparison group and time window.
Pro Tip: Never claim coaching “caused” a revenue lift from a single cohort snapshot. Report the correlation, name the confounders you couldn’t control for, and let the behavioral data carry the causal argument.
How Do You Put This Into Daily Operations?
Analytics fails as a side project. It needs owners, a rhythm, and templates people will actually fill out.
Assign clear roles: a coaching lead who sets priorities, an analyst who maintains the data joins, a manager who reviews outcome trends, and coaches who complete scorecards consistently. Without a named owner for data quality, capture drifts within a quarter.
Set a cadence that matches each metric tier: weekly stand ups on utilization, monthly reviews of behavioral trends, quarterly deep dives on outcomes. Build three reusable templates: a standardized scorecard with fixed fields, a one-page KPI dashboard wireframe, and a cohort-experiment brief that states the hypothesis, the comparison group, and the review date before the experiment starts.
- Keep coach-facing reports to one page. Nobody adopts a 12-tab spreadsheet.
- Train coaches on why each field matters, not just how to fill it in.
- Tie one small incentive to consistent data entry, not to outcome numbers themselves.
Pro Tip: Practitioner guidance on analytics adoption consistently points to the same early win: standardize the scorecard and align it to one outcome before adding anything else. Programs that chase five metrics at once rarely finish tracking any of them well.
How ClickCoach Reduces Coaching Data Friction
Much of this playbook depends on data living in one place instead of six. A practice-management platform that centralizes session notes, action plans, and assessments removes the manual joins that cause most analytics programs to stall. Some practice management platforms let coaches draft homework and follow-up actions with AI assistance, while the coach reviews and approves the final version, cutting administrative time without giving up control over client care. That’s a data-capture layer, not a KPI dashboard.
Where Coaching Analytics Delivers the Most Value Next
The biggest returns come before anyone touches a predictive model. Clean, standardized scorecards and consistent session-to-outcome joins deliver more value than a sophisticated algorithm layered on messy data. Prescriptive analytics has real promise, but only once you have reliable behavioral mediators in place to justify the recommendation. If you take one thing from this playbook, pick a single business outcome, retention, ramp time, whatever matters most, and align every KPI to it before adding more.
— Mitch Russo
Bringing the Playbook Into Your Coaching Practice
Building this yourself from spreadsheets and a call-recording tool works, but it means owning every integration and data join described above. Some practice management platforms handle the capture layer directly: session notes, action plans, recurring assessments, and client progress tracking all live in one workspace, so the “event-level join” problem that stalls most analytics programs is largely solved before you start measuring.
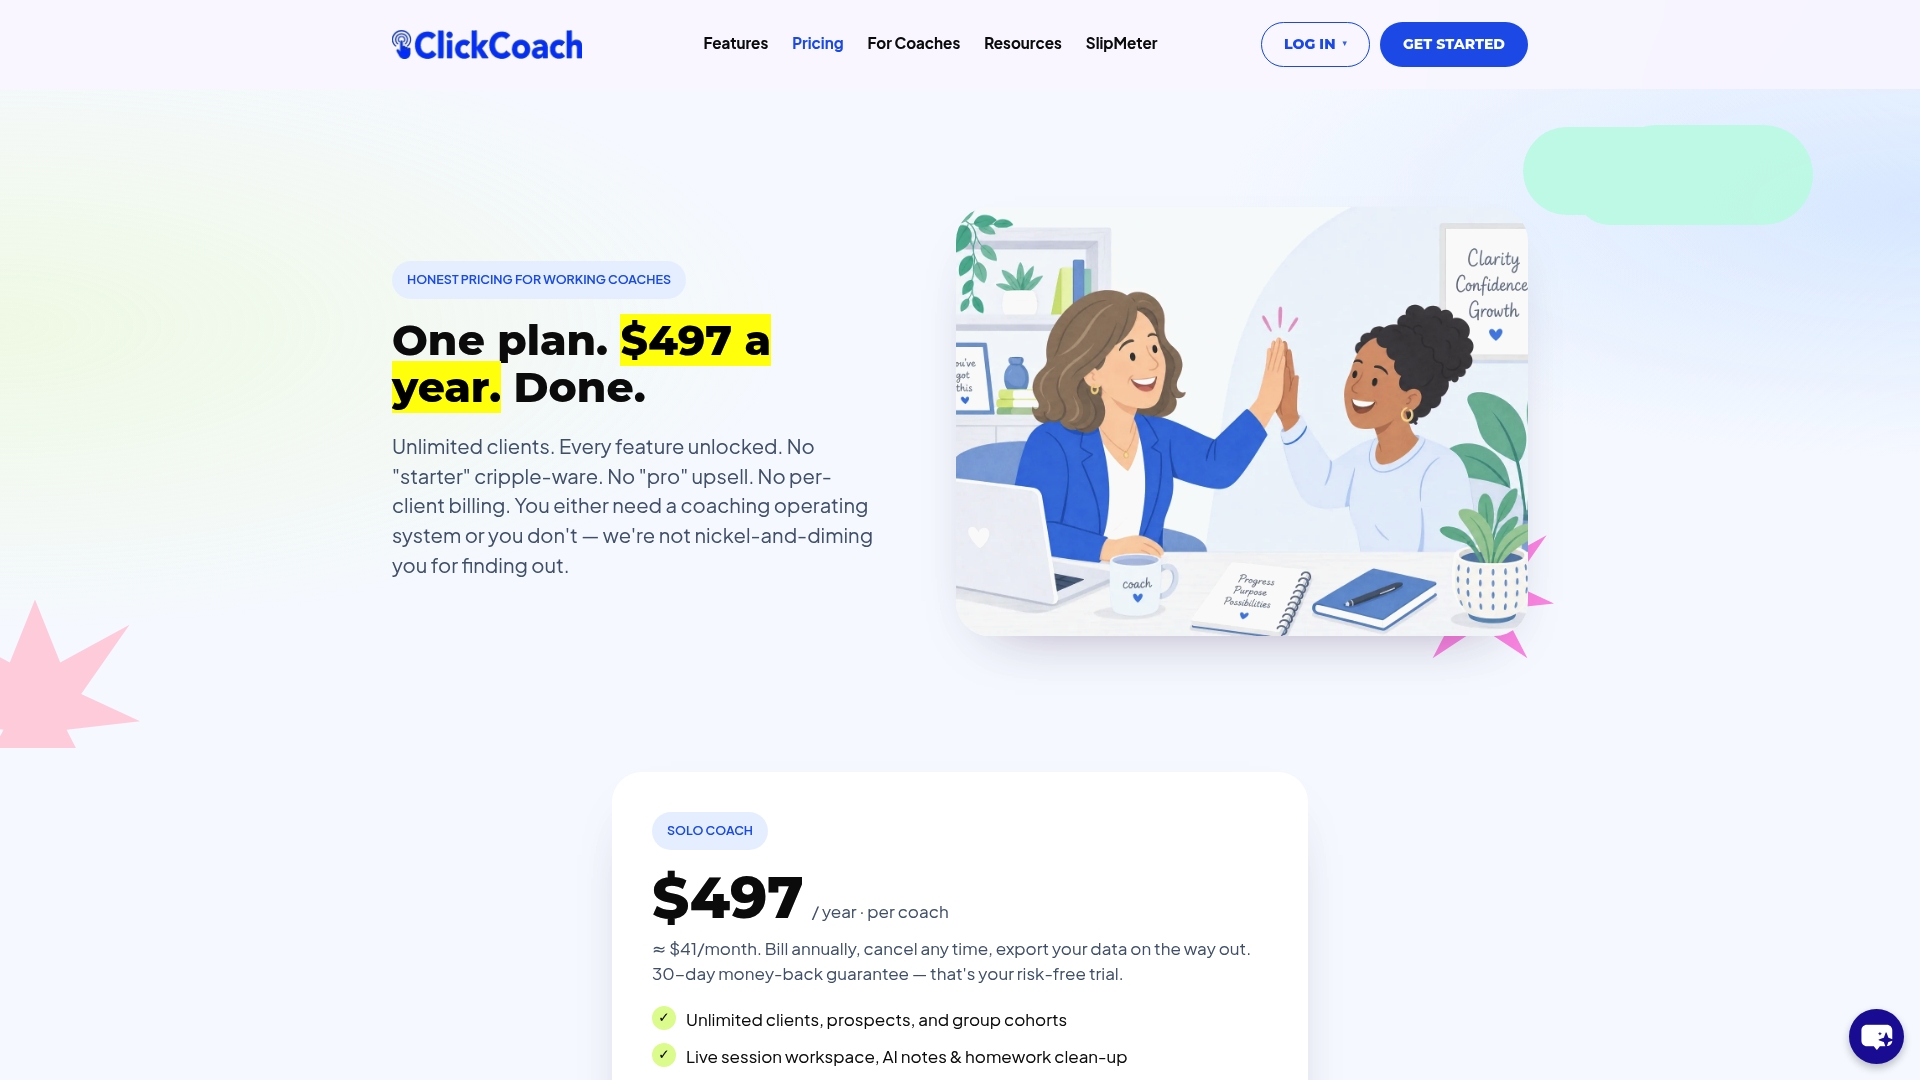
If you’re evaluating whether a practice-management platform fits your program, check whether it covers the checklist items from this article: standardized session records, action-plan tracking tied to each client, recurring assessment scores, and a client portal that keeps homework and progress visible between sessions. ClickCoach’s client portal supports that last piece directly, giving clients a place to see their own progress instead of waiting for a quarterly report.
Take a look at the coaching business management software page to see whether the workflows match how your team already operates, and start a trial if the fit looks right.
Sources
- Health and Wellbeing Coaching: Practice, Research, Career | Meridian University
- Managing the training process in elite sports: From descriptive to prescriptive data analytics (DOI)
- Coaching analytics platforms: How to measure impact of coaching on revenue
- Foundations of sports analytics: a guide for coaches and strategists - Harvard Science Review
FAQ
What Are the 5 C’s of Coaching?
The 5 C’s, commonly cited as clarity, confidence, challenge, connection, and commitment, are a widely used heuristic for coaching quality rather than a strict measurement standard.
What Is the 70/30 Rule in Coaching?
The 70/30 rule refers to talk ratio: the client or coachee should be talking roughly 70% of the time, with the coach talking closer to 30%, a widely used guideline rather than a fixed requirement.
What Are the Four Categories of Analytics?
The four categories are descriptive (what happened), diagnostic (why it happened), predictive (what’s likely to happen), and prescriptive (what to do about it), a staged framework that applies directly to coaching program measurement.
What Coaching KPIs Should I Track First?
Start with utilization metrics like session frequency and adherence, since they’re the easiest to measure reliably before moving to behavioral and outcome KPIs.
Can a Practice-Management Platform Replace a Coaching Analytics Program?
No. A platform like ClickCoach centralizes the session notes, action plans, and assessment data an analytics program needs, but you still have to define KPIs, set review cadences, and interpret the results yourself.